Ask Latest Price
Active Member
8 Years

Shenzhen ThreeNH Technology Co., Ltd.
Shenzhen ThreeNH Technology Co., Ltd Since 1998, 3nh has been a professional factory with 20 years experience on color and glossy measurement industry.

Add to Cart
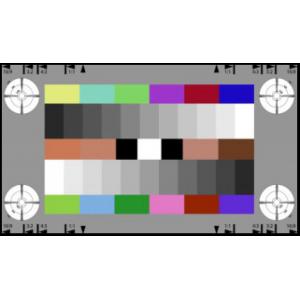
The TE256 is designed to color align HD cameras.
Two 11-graduated counter current gray scales are arranged on a gray background (D≈0.62, remission=24%), the gray scale being graduated logarithmically. Related to the densities of the gray scales: gamma = 0.45, related to the remission values (brightness): gamma = 2.2, that being exactly the reciprocal value of 0.45. The gamma factor 0.45 applies to remission > 1.8% (brightest step 100%). Between 0 and 1.8% the gamma function shows a linear progression (with the factor 4.5). The darkest step is in this area. The gamma function corresponds to Rec. 709. The output of an optimally gamma-corrected camera yields two 11- graduated counter current linear step signals (see figure below). The dynamic range of the gray scales is 63:1.
| field | 1 | 2 | 3 | 4 | 5 | 6 | 7 | 8 | 9 | 10 | 11 | BG |
| density | 0.05 | 0.14 | 0.23 | 0.33 | 0.45 | 0.58 | 0.73 | 0.91 | 1.14 | 1.43 | 1.85 | 0.62 |
Reference density values of the gray scale

two 11-graduated counter current linear step signals without color signals
The six color patches of the upper line represent the three primary colors red (R), green (G) and blue (B) as well as the three secondary colors cyan (C), magenta (M) and yellow (Y) according to the HDTV standard ITU-R BT.709 . Since it is impossible to depict the 100% saturated colors on a reflectance chart, the saturation is reduced to the maximum color space of the printer.
The six color patches of the lower line (yellow/green, blue, green, pink, red, magenta) represent the colors between the primary colors.
In addition to the gray scales and color patches for patches with skin tones are located.
| L | a | b | X | Y | Z | R'709 | G'709 | B'709 | Y'709 | C'B709 | C'R709 | ||
| Upper row | Y | 84.54 | -15.01 | 48.18 | 0.59 | 0.65 | 0.25 | 0.88 | 0.81 | 0.38 | 191 | 78 | 140 |
| C | 56.09 | 31.23 | 38.03 | 0.32 | 0.24 | 0.08 | 0.79 | 0.36 | 0.20 | 112 | 99 | 178 | |
| G | 69.76 | -32.54 | 43.76 | 0.31 | 0.40 | 0.14 | 0.54 | 0.68 | 0.26 | 152 | 85 | 117 | |
| M | 69.18 | -24.81 | -11.15 | 0.32 | 0.40 | 0.49 | 0.42 | 0.67 | 0.67 | 151 | 135 | 100 | |
| R | 57.31 | 26.01 | 27.38 | 0.32 | 0.25 | 0.12 | 0.77 | 0.39 | 0.28 | 118 | 106 | 171 | |
| B | 63.64 | -9.15 | -28.86 | 0.30 | 0.32 | 0.57 | 0.41 | 0.58 | 0.75 | 138 | 151 | 108 | |
| Skin tones | Skin 1 | 70.45 | -38.85 | 24.55 | 0.30 | 0.41 | 0.24 | 0.44 | 0.70 | 0.42 | 154 | 103 | 102 |
| Skin 2 | 3.95 | 0.31 | -1.21 | 0.01 | 0.01 | 0.01 | 0.01 | 0.00 | 0.00 | 17 | 128 | 129 | |
| Skin 3 | 94.02 | -0.86 | -3.49 | 0.85 | 0.85 | 0.9 | 0.99 | 0.90 | 0.91 | 218 | 126 | 138 | |
| Skin 4 | 61,95 | 35.55 | 0.51 | 0.41 | 0.30 | 0.30 | 0.85 | 0.41 | 0.52 | 128 | 129 | 175 | |
| Lower row | yellow | 29.43 | 51.23 | 33 | 0.12 | 0.06 | 0.01 | 0.53 | 0.00 | 0.02 | 41 | 116 | 188 |
| blue | 57.96 | 20.8 | 19.35 | 0.31 | 0.26 | 0.16 | 0.73 | 0.42 | 0.34 | 121 | 111 | 164 | |
| green | 29.62 | 42.15 | 42.67 | 0.11 | 0.06 | 0.01 | 0.50 | 0.03 | 0.00 | 44 | 113 | 180 | |
| pink | 19.71 | 41.41 | -66.68 | 0.06 | 0.03 | 0.26 | 0.08 | 0.03 | 0.52 | 32 | 182 | 129 | |
| red | 31.15 | 18.03 | 26.22 | 0.09 | 0.07 | 0.02 | 0.39 | 0.17 | 0.06 | 61 | 110 | 154 | |
| magenta | 33.11 | 45.2 | -51.37 | 0.14 | 0.14 | 0.31 | 0.39 | 0.11 | 0.56 | 60 | 172 | 155 |
Reference Lab and RGB data of the 12 color patches and four skin tone patches
Horizontal and vertical resolution wedges are positioned in circles in the four corners of the test chart. Scaling lines are shown at the outer circular lines (400, 600 and 1200 lines). In addition, cross-color interferences as well as the effects of notch filters and comb filters can be observed.
About Us:
Contact Information:
Contact Person: Clara Liu;
Email: L001@3nh.com;
Wechat & Whatsapp ID: +8613510310267;
Skype: clara.3nh